Benchmark Results: Measuring the Real Cost of Code Intelligence

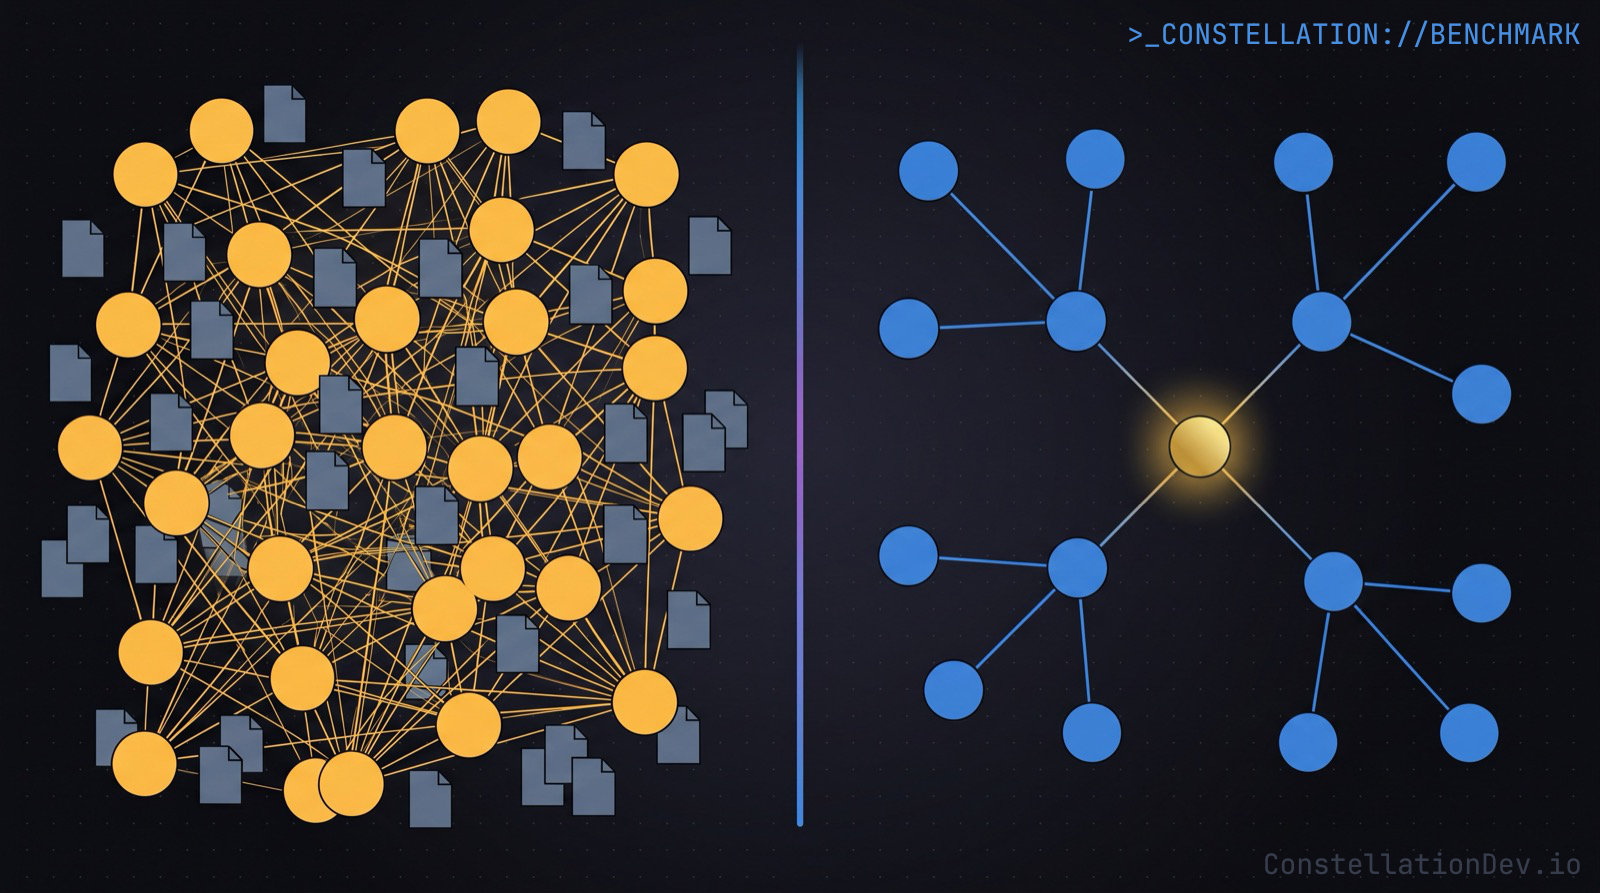
Same model. Same tasks. Same codebase. One tool that already knows the structure.
We've written about why structural code intelligence matters, how Code Mode makes MCP queries more efficient, and the case for a shared code intelligence layer across your team. What we hadn't published yet was the metrics. The actual difference, in tokens and dollars, between an AI agent navigating a codebase with Constellation versus without it.
That changes today. Our Q2 2026 benchmark results are out, and the data is cleaner than we expected.
The Setup
The benchmark is straightforward: two arms, tightly controlled.
- Baseline: Claude Code (Sonnet 4.6) with no Constellation MCP server attached — answering code intelligence questions the conventional way with file reads, grep, and import chasing.
- Constellation: The same assistant, same model, same prompt, with the Constellation MCP server attached and permitted to query the code graph.
Both arms start from an identical, empty conversational context. Project-specific guidance files, persistent memory, and any prior session state are zeroed out before each run. The only variable is whether Constellation is available.
Nine operations. Three iterations each. 54 total runs.
Full methodology details are available on the Benchmarking Methodology page if you want to dig in.
The Numbers
10.7M tokens to run all nine operations on the baseline.
2.6M tokens on Constellation.
A 75% reduction in total token spend.
Cost tells a similar story: $5.43 for the full baseline suite, $1.52 with Constellation. A 72% reduction.
One thing worth knowing before diving into the per-tool numbers: token count and cost don't track each other perfectly. Token pricing is split across input, output, and cached tokens, each priced differently. A 75% drop in total tokens doesn't automatically produce a 75% drop in cost, and the data reflects that. We break it down in the full report.
Where the Gap Is Biggest
Three operations drive most of the difference:
Finding Orphaned Code
Orphaned code detection is the starkest result in the benchmark.
Baseline: 5.13M tokens.
Constellation: 318K.
That's a 16× reduction.
Without Constellation, the model has to navigate the entire dependency tree manually to determine what's referenced and what isn't. With Constellation, that context is already in the index.
Cost drops from $2.13 to $0.12.
Change Impact Analysis
Impact analysis asks: if I change this, what breaks? On baseline, the model chases every reference — reading files, following imports, working outward from the symbol in question. The process is thorough but slow and expensive.
With Constellation, the impact graph is pre-computed. One query, structured result, done.
Baseline: 2.32M tokens, $0.79.
Constellation: 230K tokens, $0.13.
A 10× token reduction and 83% cost savings.
Finding Circular Dependencies
Cycle detection is a graph problem, and the baseline is trying to solve it without a graph. The model reads files, builds a partial model, checks for loops, and expands from there. This is the kind of analysis that compounds — every discovered dependency leads to more file reads.
The graph already has the edges. Constellation answers in a fraction of the tokens. Baseline: 1.44M tokens, $0.83. Constellation: 197K tokens, $0.07. 7× fewer tokens, 92% cost savings.
The Middle Ground
Not every result is dramatic. A few operations fall somewhere between "roughly a wash on tokens" and "moderate savings":
getDependents: Constellation uses 2.8× fewer tokens and cuts cost by 84%. A solid win, though smaller in absolute terms.getCallGraph: Token counts are nearly identical (baseline: 572K, Constellation: 592K). Cost drops 38% anyway because of how the token types are distributed across the operation.traceSymbolUsageandgetDependencies: Constellation uses slightly more tokens on both of these (605K vs 528K and 101K vs 86K, respectively), though cost savings of around 18% persist. These are operations where the overhead of graph queries is close to parity with reading files.searchSymbols: Roughly a wash on both metrics, with a small edge to Constellation. When you're looking for a symbol you can approximately name, both approaches converge quickly.
Where Constellation Falls Behind
We're publishing all the data, including the one operation where Constellation doesn't dramatically reduce token usage or costs: getSymbolDetails.
Baseline: 58K tokens, $0.025.
Constellation: 183K tokens, $0.066.
Constellation is 3.2× more expensive here.
The reason isn't surprising in hindsight. Getting details about a specific symbol is a lightweight operation for the baseline. Open one file, read a function. Constellation's code mode tooling and additional symbol details and metadata add non-trivial overhead to the operation. Constellation enriches symbol detail responses with additional structural context (cyclomatic complexity, export state, and more), which adds value but adds tokens.
This is an honest result, and it points to where the design holds. Constellation wins where analysis is hard. For trivial file reads with a clear target, the advantage goes to the baseline. The further the task is from "read section of this one file," the more the graph earns its place.
Why the Pattern Holds
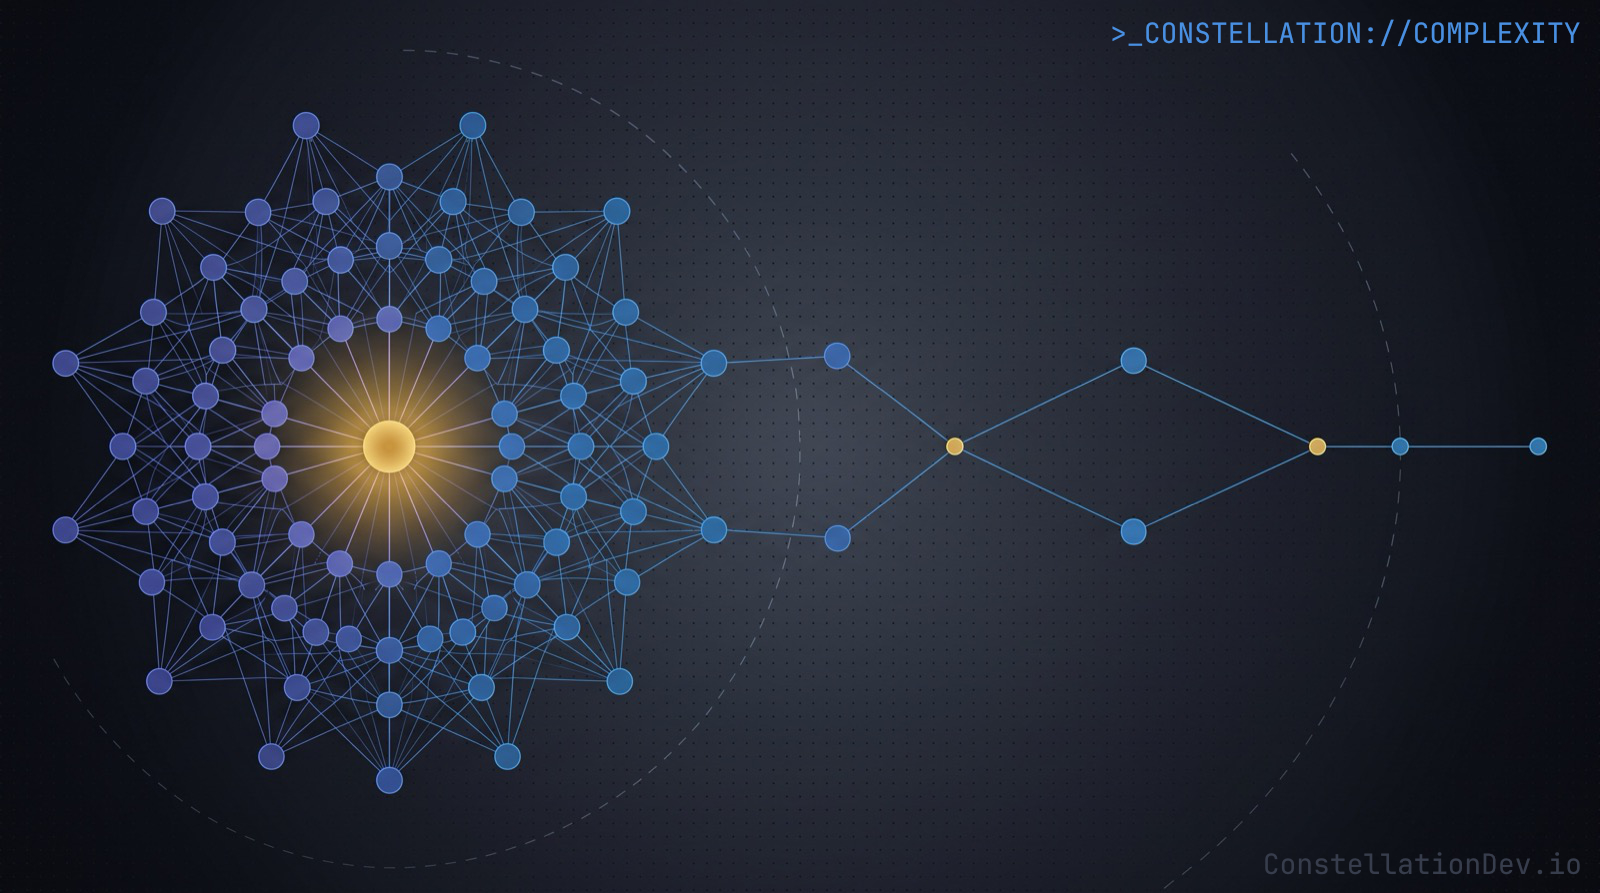
The results across all nine operations follow the same underlying logic: Constellation wins in proportion to how much work the baseline has to do to reconstruct information that the graph already has.
Orphaned code detection requires understanding the entire dependency structure. Impact analysis requires tracing every consumer of a symbol, transitively. Circular dependency detection requires holding the full import graph in memory. All three require the model to discover structural information that, with Constellation, is already indexed and queryable.
Simple symbol lookups don't have that overhead gap. The graph query cost meets or exceeds the cost of just reading a file. The benchmark data shows this clearly, and we'd rather put it in the report than paper over it.
The Full Report
Per-tool breakdowns, token comparison charts, methodology details, and the cost analysis are all available in the Q2 2026 Benchmark Report.
We'll be running these calibrations periodically and publishing updated results as tooling and models evolve. The numbers will shift over time; the methodology will stay consistent.
At ShiftinBits we're building Constellation, the shared code intelligence layer for AI coding agents. Constellation maintains a team-wide knowledge graph of your codebase and exposes it to tools like Claude Code, Cursor, GitHub Copilot, and Windsurf via the Model Context Protocol (MCP), giving them structural understanding of your code with symbol-level search, dependency graphs, impact analysis, and more.
If you're building with AI coding tools and want to see what your agents can do with real code intelligence, check out Constellation. For a limited time, we're giving early adopters 50% off with the promo code ROOTNODE50.